
 The fragment count in the standardized fragmentation test in the standard EN 12150-1 is the way to define the safety level of tempered glass and a way to also get an indication about the stress and strength level of the tempered glass.
Even though the way to count the number of fragments is defined in the standard by example, the actual result always depends on the examiner. To make the counting consistent across the examinations and examiners, an automated process of fragment counting is needed. This makes it a perfect application for a computer vision system since computer never tires or loses its objectiveness. Systems for automated fragment counting already exist, but they have severe limitations
Modern tools and technologies have revolutionized the field of computer vision in recent years. Mainly this is due to the advances in convolutional neural networks, which are especially suitable for extracting patterns and information from visual imagery. To make fragment counting systems more flexible, faster and cheaper, these recent advances in computer vision allow automated computer vision system to be implemented even on a mobile smartphone.
Introduction
Tempered glass is produced by the heat treatment process where glass pane is first heated beyond its transition temperature and then subsequently cooled rapidly to produce a temperature gradient through the thickness. The aim is to freeze the glass when the glass has temperature gradient and then after when temperature gets uniform the residual state is a parabolic stress profile through the glass thickness. Tempered glass is in compression at the surface and in tension in the core of the glass.
Tempered glass has two advantages compared to annealed float glass. Firstly, the strength of the glass for bending and impacts is increased with the compressive stress in surface and secondly, in breakage the glass fractures into small harmless particles due to high induced strain-energy. Due to these advantages tempered glass is also called as a safety glass.
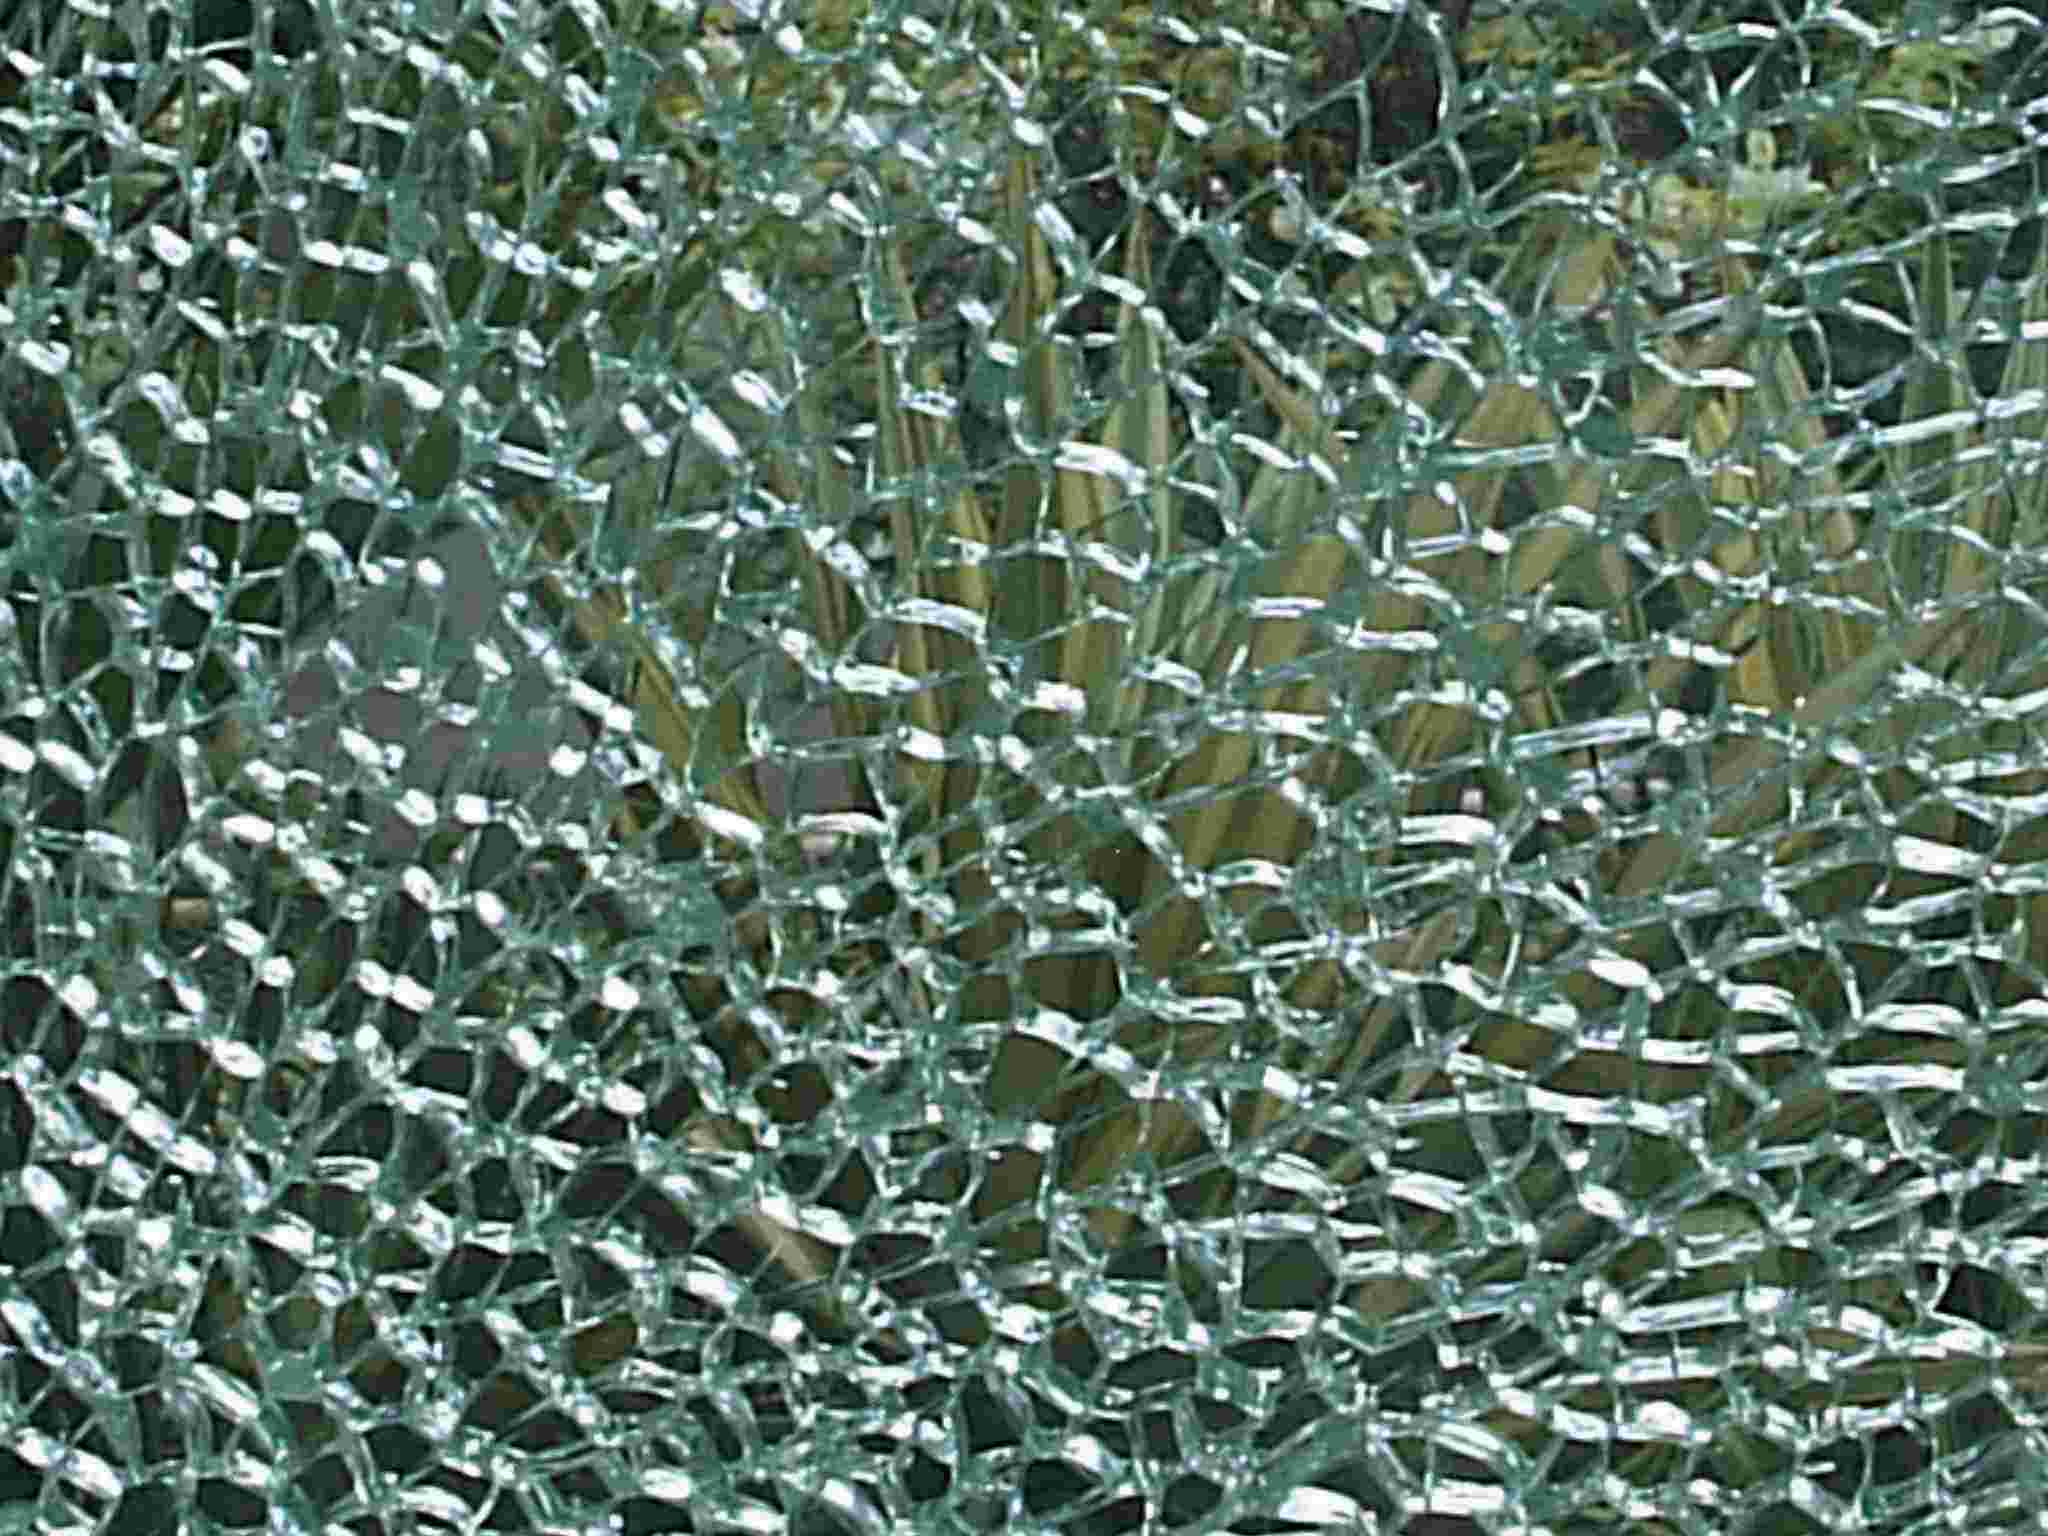
The destructive test and the fragmentation due to breakage is the way to define the stress and safety level of the tempered glass. The fragmentation shows several things from the stresses, e.g. the stress level and the uniformity of the stresses. In the standard EN 12150-1 [1] has defined the punch test where 1100 x 360 mm² size tempered glass is impacted with a pointed tool at the mid-point of the longest edge.
 From the breakage pattern, the number of the particles in the 50 x 50 mm² area is counted from the minimum fragment count area. The standard defines the minimum level of the fragments for different glass thicknesses for the safety of the architectural glass. Automotive glass has similar ECE R43 [2] standard for safe fragmentation. In comparison to EN 12150-1 standard, in the ECE R43 standard glass is impacted at the center area of the glass.
The fragmentation of the glass and its connection to the stress level has been studied already in the 1960s, an example being the well-known results from Akeyoshi et al. [3]. They defined the relationship between the number of fragments and the midplane tensile stress level for different glass thicknesses between 1.8 mm and 8.2 mm.
 In 1968, Barsom [4] also published the results about the correlation of the center tension and average particle weight in tempered glass. Recently, studies have been published by Pourmoghaddam & Schneider [5] and Pourmoghaddam et al. [6] which define the relationship between the stress level and the fragmentation as also predicts the shape and distribution of fragments based on stress level and impact point.
The counting of fragments is essentially a visual task, where the human operator uses his brains very efficiently to separate individual shards from the broken glass. For a human, this task seems very easy and it is easy to forget how such a task requires very sophisticated and well-developed pattern recognition abilities, which is the very purpose our brains have developed for. The definition to count the number of fragments is simple and shown as an example in standard EN 12150-1 [1].
However, while the task may seem easy, it is very laborious and timeconsuming. The counting process is also very repetitive and prone to human errors due to lack of concentration and fatigue. Due to that it possible that counting results may and vary across examiners. Especially, when the fragment number is high, the size of fragments is small and by the human eye it might be difficult to define which are the smallest fragments to count and which fragments are inside the counting area.
In the traditional automated process, the photo of the fragmentation pattern is processed and analyzed with image analyzing tools [7]. There are equipment for automated fragment counting based on image analysis like CulletScanner from SoftSolution and FROG:Fragment recognizer of glass by Deltamax.
Recently, the machine learning has revolutionized the field of computer vision, as deep neural networks are able to learn very abstract representations of the underlying data. This gives new tools to analyze fragmentation patterns. However, deep neural networks need a good amount of wellannotated data. This is the time-consuming part to make a good model for particle counting.
In this paper, the focus is to present a novel way to count the fragments in the tempered glass by using the latest advances in the field of machine learning. Also, the importance of the annotation of the data for deep learning is presented. Before the machine learning chapter, the background about the glass breakage is presented to better understand the problems of the counting of the number of fragments in tempered glass.
Theory of glass fragmentation
The glass fragmentation after breakage is mainly stress dependent. In the fragmentation process, the growth of the cracks can be divided into the two parts. Firstly, the glass needs a high enough stress level for cracks to grow spontaneously. This stress level is needed already from the heat strengthened glass when all the cracks should grow to the edge. Secondly, from the tempered glass, the bifurcation of the cracks is needed for the high fragment count. This bifurcation phenomenon needs higher induced stress level. [8]
The initial fracture point and external support or force affect the fragmentation of the glass. These things have an influence on the stress distribution on the crack tips and due to that, the fragmentation pattern changes. [8,9] Due to this, the initial fracture point is defined in the standard. The time after the breakage when the number of the fragments should count is set to 3 to 5 minutes in the EN 12150- 1 standard [1]. This is also important to take into consideration because after the initial crack propagations secondary cracks are forming. These secondary cracks are usually in perpendicular to initial crack edges and the number of those is also dependent on the initial stress state.
Fragmentation of the thin and thick glasses are similar. However, for thicker glasses, the crack edges are rougher than for thinner glasses. Also, for thick glass, the fracture edge surface can be tilted. The typical fracture pattern of 4 mm and 10 mm nominal thickness glasses are shown later as an example in Figures 9 and 10, respectively. The rougher crack edge causes the wider crack line and the tilted crack surface can be seen as a white area due to the high scattered reflection of the light from the crack surface. These both can affect the counting of fragments.
One approach to fragment count is to define the relationship between the residual stress level of the glass and the fragment count. This is important if the optical stress measurement equipment is used for quality check of the tempered glasses. The relationship between scattered light polariscope (SCALP-05) [10] measured mid-plane tensile stress and counted fragment number is shown in Figure 1. The tests are done with 1100 x 360 mm² glass sizes. The experimental data is compared to the data by Akeyoshi et al. [3]. The experimental results by authors give higher fragmentation level for glasses comparing to data by Akeyoshi et al. [3].
Figure 1. Relationship between mid-plane tensile stress and the number of fragments in 50 x 50 mm2 area. The experimental results for 4 mm, 6 mm, 8 mm and 10 mm nominal glass thicknesses (dots) and comparison data from Akeyoshi et al. [3] for 1.8 mm, 3.0 mm, 3.4 mm, 4.9 mm and 8.2 mm glass thicknesses.
Figure 1. Relationship between mid-plane tensile stress and the number of fragments in 50 x 50 mm2 area. The experimental results for 4 mm, 6 mm, 8 mm and 10 mm nominal glass thicknesses (dots) and comparison data from Akeyoshi et al. [3] for 1.8 mm, 3.0 mm, 3.4 mm, 4.9 mm and 8.2 mm glass thicknesses.
Automating the counting of fragments with machine vision
Convolutional neural networks (CNN) have for long been dominating the field of image classification and object recognition. In 2012, a deep convolutional neural network (DCNN) first reached state-of-the-art performance in ImageNet Large Scale Visual Recognition Competition (ILSVRC) [11]. The breakthrough that DCNNs brought was that no longer sophisticated, hand-crafted features of the input space were required.
Before deep learning, a typical image classification pipeline would consist of a classifier trained with the hand-crafted features. This has some problems since humans are not necessarily very efficient at defining the features that best distinguish the input classes. The advantage of deep learning is that the task-specific features are automatically extracted by the network and it can be directly trained end-to-end, from input images to output classes.
However, glass fragment segmentation is not simply an image classification problem. Rather, it is a pixel classification problem. The process where each pixel in the input image is classified to a certain class is called semantic segmentation. After the breakthrough of deep learning, it did not take long until the new technologies could be transferred from image classification to semantic segmentation.
The problem is that classification networks have very low output resolution since the output is defined simply as a vector of class probabilities. In semantic segmentation, however, the output resolution should be as high as the input image resolution. The work by Long et al. [12] showed that the existing classification networks could be transferred into semantic segmentation networks. That was done by casting the classification into fully connected neural networks (FCNN) by adding an in-network upsampling and a pixelwise loss.
The work by Long et al. was still only a first step toward high-performance semantic segmentation. Since then, more sophisticated networks have continuously pushed the stateof-the-art performance. As of 2018, the best performing semantic segmentation network is DeepLab v3+ by Google [13], which is also adopted in this work to the task of glass fragment segmentation.
Theory
The theory behind the fragment counting pipeline used in this work is presented in Figure 2. The pipeline consists of Google’s DeepLab v3+ system to perform the segmentation and a postprocessing algorithm to do the actual counting.
Figure 2. Fragment counting pipeline.
Figure 2. Fragment counting pipeline.
The DCNN, ASPP and DECODER block in Figure 2 are parts of the DeepLab v3+ system. The encoder is a standard deep convolutional neural network which is used as a feature extracting part of the network. In particular, a residual network architecture [14] is used in this work. The output of the encoder is directed to an atrous spatial pyramid pooling (ASPP) module, which samples the feature map with different receptive fields (field of view) to capture the multi-scale context.
A decoder is used to restore the spatial resolution of the input image. The decoder essentially combines the low-resolution, rich semantic information from the ASPP module with the high-resolution spatial information from the encoder module. The result is a high-resolution segmentation mask of the original raw input image.
The segmentation mask given by the DeepLab system is further post-processed to obtain the fragment count. Each fragment instance is thresholded such that any small connections between adjacent shards are removed. After this, the fragment count can be obtained trivially by counting every connected region in the binary segmentation mask.
Data annotation
Modern deep learning neural networks rely heavily on the amount of data they can utilize during training. They adjust their internal representation of the problem by iterating over the dataset multiple times. With very sparse data, this leads to a possibly overfitted model that has only learned a very specific set of data. This kind of model is usually unable to generalize to the whole domain of the problem, making it unusable in a wider range of applications.
This case is no different. However, in the case of glass fragment segmentation, the dataset is much simpler than for example general images gathered from the internet. In glass segmentation, only one class of objects is presented: the fragment itself. The neural network model has to learn how to distinguish between a fragment and non-fragment regions. An example of a widely used, more complex dataset is ImageNet, which contains over 15 million images belonging to roughly 22 000 different categories [15]. The images are collected from the internet and annotated by humans. Modern neural networks have shown human-level performance even on very challenging datasets such as ImageNet [16].
Data annotation is very time consuming and expensive due to the need for human labor. The amount of data is usually a bottleneck in model performance, especially when applied to a specific task and no freely available datasets can be utilized. Glass fragmentation is an example of such a problem. For the model to learn how to segment the fragments, it must be shown numerous examples of correct, or ground truth, segmentations.
Annotation process
In Figure 3, examples of ground truth segmentations are shown. These examples are human-crafted, and each sample requires around 10-30 minutes of time, depending on the experience of the annotator. The annotation process is quite simple: each fragment is labeled with a polygon by defining its vertices.
As it can be seen from the samples, the process is also highly subjective. Each person does the segmentation somewhat differently. However, the annotation should be done such that sufficiently wide gaps are left between any adjacent polygons. This enforces the model to reliably separate adjacent shards, which is critical to obtain quantities such as the shard count. In a raw image, the shard edge might sometimes only be a few pixels wide and practically indistinguishable from the background. In these cases, wider gaps are left between the label polygons.
Figure 3. Samples of raw images and corresponding ground truth annotations for different glass categories.
Figure 3. Samples of raw images and corresponding ground truth annotations for different glass categories.
Experiment on the subjectivity of fragment counting
The task of fragment counting is very subjective by its nature. It is often not clear which areas of the broken glass can be counted as individual shards and even the standard does not give unambiguous instructions for it. Therefore, the actual person doing the fragmentation test can have a significant effect on the fragment count even when the fragments are counted from the same region. Even more, variation is introduced, when the individuals are required to choose the region of least fragments. In Figure 4, the area of interest for the fragmentation test defined by EN 12150-1 standard [1] is presented.
Figure 4. Area of interest in the fragmentation analysis. All areas inside the dashed line should be included in the analysis.
Figure 4. Area of interest in the fragmentation analysis. All areas inside the dashed line should be included in the analysis.
The subjective nature of fragment counting was experimentally investigated. The goal of the experiment was to investigate the variation in fragment counts across several human examiners. The test consisted of two test samples of thicknesses 4 mm and 10 mm. Two glass thicknesses were chosen because the fragmentation pattern is very different for thin and thick glass. Thickness has a significant effect on breakage pattern and visual appearance of fragments. In general, it is easier to count fragments from thinner glass. The test was organized as follows. Two standard-sized (1100 x 360 mm²) tempered glasses with 4 mm and 10 mm thicknesses were broken. Each individual counted the fragments from two separate 50 x 50 mm² regions: one from the center of glass and one freely chosen region (inside the dashed line of Figure 4) of least fragments. The coordinates of freely chosen regions were also reported to compare how each individual finds the least cullets areas from the glass.
The fragmentation patterns of the 4 mm and 10 mm test glasses are shown in Figures 5 and 6, respectively and the fragment counting results for both glasses are shown in Table 1. Also, the heatmaps for the fragment distribution for both samples are presented in Figures 6 and 7. On top of each heatmap, rectangles specifying the freely chosen areas are drawn.
Figure 5. Fragmentation pattern of 4 mm test sample.
Figure 5. Fragmentation pattern of 4 mm test sample.
Figure 6. Fragmentation pattern of 10 mm test sample.
Figure 6. Fragmentation pattern of 10 mm test sample.
In the heatmaps, the blue color indicates a lower density of fragments while yellow color indicates higher density. In both cases, most of the examiners have chosen the area in the topright region, which is indeed the area of lowest fragment density within the allowed area of interest described in Figure 4. However, some examiners have ended up with different regions and it introduces further variation to the final fragment count for the sample.
Table 1. Results of an experimental test of fragment counting
Table 1. Results of an experimental test of fragment counting.
The results show that there is significant variation in fragment counts across human examiners, even when everyone counted fragments from the exact same region. Differences are even greater when the examiner freely chooses the area of least cullets.
For the 4 mm glass, the count of the AI model is within 1 standard deviation of the average human count. For 10 mm glass, it is slightly further away. However, this does not mean that the AI model is wrong since the task is highly subjective. The images of the center regions of the test samples are shown in Figures 7 and 8 and the corresponding overlay images of the AI segmentation are shown in Figures 9 and 10.
Figure 7. Heatmap of fragment distribution for 4 mm sample and red rectangles showing the freely chosen regions in the experiment.
Figure 7. Heatmap of fragment distribution for 4 mm sample and red rectangles showing the freely chosen regions in the experiment.
Figure 8. Heatmap of fragment distribution for 10 mm sample and red rectangles showing the freely chosen regions in the experiment.
Figure 8. Heatmap of fragment distribution for 10 mm sample and red rectangles showing the freely chosen regions in the experiment.
The corresponding fragment counts of the AI model for 4 mm and 10 mm samples were 98 and 68, respectively. These images demonstrate the difficulty of fragment counting: in the images, there are many small fragments that the AI system has counted as individual fragments and a human might not. This is especially true in the case of a 10 mm sample. In the segmentation image of the 10 mm sample, one can see that the AI system has included many small fragments to the final count, which is not wrong but results in a higher number than the average human examiner. One benefit of the automated system is that it is consistent in its decisions and the results do not vary due to tiredness, lack of concentration or other conditions affecting human examiners.
Summary
The difficulties of the fragment counting were experimentally investigated and results are presented in this paper. The results showed that fragment counting is not a trivial task and since there are no clear instructions for the process in the standards, the counting results may vary significantly across examiners. Relative standard deviations of the fragments for the center regions of 4 mm and 10 mm samples were 4.9% and 6.4%, respectively.
Additionally, the differences in counting is not the only thing affecting the final fragment count. The examiner must also determine the area of lowest fragment density, which introduces more variance. For the free chosen regions of 4 mm and 10 mm samples, the respective relative standard deviations were 8.0% and 9.9%.
A machine learning based approach to fragment counting is also presented in this paper. It was shown that modern deep learning and computer vision technologies are capable of accurately count fragments from an image of broken glass. An automated approach has the benefit of objective and consistent results. However, this kind of approach is highly dependent on the available data, which is cumbersome and expensive to obtain.
References
[1] EN 12150-1:2015, 2015, Glass in Building – Thermally Toughened Soda Lime Silicate Safety Glass – Part 1: Definition and Description, CEN.
[2] E/ECE, 2017, Agreement concerning the Adoption of Uniform Conditions of Approval and Reciprocal Recognition of Approval for Motor Vehicle Equipment and Parts. Addendum 42, Regulation No. 43, Revision 4: Uniform Provisions Concerning the Approval of Safety Glazing Materials and Their Installations on Vehicles, Annex 5, April 2017
[3] Akeyoshi, K., Kanai, E., Yamamoto, K., Shima, S., 1967, Rep. Res. Lab., Asahi Glass., 17, pp. 23.
[4] Barsom, J.M., 1968, Fracture of Tempered Glass, J. Am. Ceram. Soc. vol. 51, pp. 75-78. https://doi.org/10.1111/j.1151-2916.1968.tb11840.x
[5] Pourmoghaddam, N. & Schneider, J., 2018, Experimental investigation into the fragment size of tempered glass, Glass Struct Eng, vol.3, pp.167-181. https://doi.org/10.1007/s40940-018-0062-0
[6] Pourmoghaddam, N., Kraus, M.A., Schneider, J., Siebert, G., 2018, Relationship between strain energy and fracture pattern morphology of thermally tempered glass for the prediction of the 2D macroscale fragmentation of glass, Glass Struct Eng. https://doi.org/10.1007/s40940-018-00091-1
[7] Gordon, G.G., 1996, Automated glassfragmentation analysis, Proc. SPIE 2665, Machine Vision Applications in Industrial Inspection IV. https://doi.org/10.1117/12.232245
[8] Gardon, R., 1980, Thermal Tempering of Glass, in Glass Science and Technology vol. 5 Elasticity and Strength in Glasses, D.R. Uhlmann and N.J. Kreidl (Eds.), Academic Press, New York, pp. 145-216.
[9] Aronen, A., Kocer., C., 2015, The Mechanical Failure of Tempered Glass; a Comparison of Testing Standards and In-Service Catastrophic Failure, in Proceedings of GPD Glass performance days 2015, pp. 388-391.
[10] Anton, J., Aben, H., 2003, A Compact Scattered Light Polariscope for Residual Stress Measurement in Glass Plates, in Proceedings of Glass Proceedings Days 2003, pp. 86-88.
[11] Krizhevsky, A., Sutskever, I., Hinton, G.E., 2012, Imagenet Classification with Deep Convolutional Neural Networks, Advances in Neural Information Processing Systems, Curran Associates, Inc., pp. 1097-1105.
[12] Long, J., Shelhamer, E., Darrell, T., 2015, Fully convolutional networks for semantic segmentation, 2015 IEEE Conference on Computer Vision and Pattern Recognition (CVPR), IEEE, pp. 3431-3440.
[13] Chen, L., Zhu, Y., Papandreou, G., Schroff, F., Adam, H., 2018, Encoder-Secoder with Atrous Separable Convolution for Semantic Image Segmentation, CoRR, 2018, Available (accessed 09.05.2018). https://arxiv.org/abs/1802.02611.
[14] He, K., Zhang, X., Ren, S., Sun, J., 2016, Deep Residual Learning for Image Recognition, 2016 IEEE Conference on Computer Vision and Pattern Recognition (CVPR), IEEE, pp. 770-778.
[15] Russakovsky, 0., Deng, J., Su, H., Krause, J., Satheesh, S., Ma, S., Huang, Z., Karpathy, A., Khosla, A., Bernstein, M., 2015, Imagenet Large Scale Visual Recognition Challenge, International Journal of Computer Vision, Vol. 115, pp. 211-252.
[16] Russakovsky, O.,Deng, J., Su, H., Krause, J., Satheesh, S., Ma, S., Huang, Z., Karpathy, A., Khosla, A., Bernstein, M., ILSVRC 2017, ImageNet, web page. Available (accessed 09.05.2018). https://image-net.org/challenges/LSVRC/2017/results.
Post time: Dec-12-2019